(This article was first published in the UK electronics magazine EPE, July 2000. Pico Technology would like
to thank the magazine for permission to re-print the article.)
1. Getting connected
2. Software
3. Internal Sensor Specification
4. PicoScope Software
5. PicoLog Software
6. Optional extras
6. Conclusion
PICO TECHNOLOGY is a company that is best known for its PicoScope interfaces, which turn practically
any PC into a storage oscilloscope. In fact the current software provides several additional functions
such as frequency measurement and spectrum analysis.
The DrDAQ unit reviewed here could be regarded as a greatly simplified version of the PicoScopes. It is
an analogue-to-digital converter that connects to the parallel port of a PC, but it has a relatively slow
maximum sampling rate of 10kHz to 15kHz, depending on the speed of the PC used. The interface has
no built-in memory, but with such a modest maximum sampling frequency the PCs memory can be used
if storage facilities are required.
Although high-speed sampling is not possible, this interface is still adequate for many purposes, such as
measuring temperature, light levels, pH, etc. It can also be used for sampling audio frequency signals,
albeit with a somewhat limited bandwidth.
DrDAQ is primarily aimed at educational establishments, but it would also seem to be a worthwhile
proposition for professional electronic engineers. At a VAT exclusive price of £59 for the basic version
it is within the budget of many electronics hobbyists as well. The basic version comprises the interface
and a parallel port connecting cable, plus two programs and the necessary drivers. No power supply
unit or batteries are required because the inter-face taps off the small amount of power it requires
from the parallel port. Consequently, getting the interface ready for use is just a  matter of connecting one end of the supplied cable to the interface matter of connecting one end of the supplied cable to the interface
and the other to the parallel port of the PC. There is no through-port connector on the interface, so it
will either require its own parallel port or a switching unit will be required to enable one port to operate
with either the interface or a printer.
The interface unit is an uncased printed circuit board that seems to have most of the components on
the underside, where they are hidden by a foam covering that ensures the unit will not scratch
tabletops. On top of the board (Fig.2) there is the parallel port connector at one end, and three
sockets plus a microphone at the other. The built-in microphone enables sound waveforms to be
displayed and sound levels to be measured. One of the input sockets is a BNC type that is intended
for use with a standard pH sensor. The other two are telephone style connectors that are intended
for use with temperature sensors, etc.
There is also a l.e.d. indicator and a 4-way connector block that provides a ground terminal, a digital
output, and voltage plus resistance inputs. The l.e.d. and the output can be set to operate at a given
threshold level so that they can be used in alarm and control applications. Last and by no means least,
there is a photo-resistor light sensor and a semiconductor temperature sensor. With three integral
sensors the interface is clearly useful for a variety of experiments and applications even without any
external sensors added.

The review unit came complete with three floppy discs containing the software, but the production
units will have the software on CD-ROM. The software is compatible with Windows 3.1, 95, 98, 2000,
and NT. Under Windows 98 the software loaded without any difficulty and the installation process
follows along normal Windows lines. There are various installation options to select, such as choosing
the pro-grams you wish to install (Fig.1), but simply selecting the defaults is all that will normally be
required. There are two applications programs provided, called PicoScope and PicoLog. PicoScope
provides an oscilloscope style display and is used to display data gathered over a relatively short
period, whereas PicoLog is primarily for gathering data over much longer time-spans. PicoScope is
therefore used for such things as viewing audio waveforms (Fig.3) or showing temperature data from
experiments that produce rapid changes in temperature. PicoLog is used for an application such as
logging weather data over a period of days.
Internal Sensor Specification
| Channel |
Range |
Resolution |
Accuracy |
| Sound Waveform |
±100 |
0·3 |
– |
| Sound Level |
55-100dBA |
1dBA |
5dBA |
| Voltage |
0-5V |
5mV |
3% of f.s.d. |
| Resistance |
0-1M |
100 . at 10k |
2% at 100k 400 . at 100k |
| pH |
0-14 |
0·02pH |
Calibration dependent |
| Temperature |
0-70 degrees C |
0·1 at 25°C |
2 at 25°C |
| Light |
0-100 |
0·1 |
– |
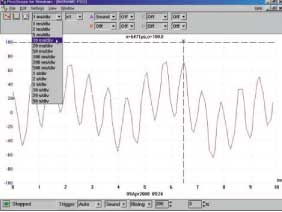
Starting with PicoScope, this is very similar to the software supplied with the Pico range of storage
oscilloscope interfaces, but some concessions have to be made to the slower sampling rate of DrDAQ.
Accordingly, the fastest sweep rate is 1ms per division, but at the other end of the range the slowest
rate is a generous 50s per division. A panel having a pop-down menu enables sweep rates to be
selected, and the times are in the usual 1-2-5-10 progression, as can be seen in Fig.3.
The same method is used to select a multiplication factor from 1 to 200, and this enables part of the
waveform to be viewed in detail. Of course, high multiplication factors are only a practical proposition
at the slower sweep rates where there are enough samples taken to permit a magnified view.
Most things can be handled by the on-screen controls, but there are the usual pop-down menus and
dialogue boxes as well. For example, the Trigger dialogue box is shown in Fig.4. The basic trigger
options are none (free running), auto, repeat, and single, with a fully adjustable trigger level. The
dialogue box offers further options such as a preset delay, triggering on the rising of falling edge of a
signal, and the channel used as the trigger source. There are four channels available, and each one
can be used to measure Sound (waveform or level), Volts, Ohms, pH, Temperature, Light, or one of
the external inputs. It is possible to have all

four channels operating simultaneously, with each trace drawn in a different colour. However, results
are easier to follow with just two traces, see Fig.5. The three buttons towards the top left-hand
corner of the screen enable the required function to be selected. By default the program starts in
oscilloscope mode, but the buttons enable oscilloscope, spectrum analyser, and volt-meter functions
to be selected.

Operating a button does not switch the current window to a new operating mode, but instead launches
a new window. You can therefore have something like two oscilloscopes in operation simultaneously,
or three windows with each one operating in a different mode (Fig.6). For this type of thing it is
obviously advantageous to use a large monitor running at high resolution. The volt-meter and analyser
features are useful, but the abilities of the latter are severely restricted by the relatively low sampling
rate.
The program has facilities for printing traces, etc. to any Windows compatible printer, and data can be
saved to disk and exported via the clip-board. The clipboard enables data to be exported in graph
form or as a text file containing a list of readings. There are various set-up options that provide control
over the screen colours, maximum number of screen updates per second, and various other factors.


By its nature, PicoLog is somewhat less straightforward to use. There are actually two programs, which
are the recorder and the player. However, the recording program also has play-back facilities, and is
possible to log and analyse data without resorting to the playback program. We will only consider the
recording program here. The playback facilities of the playback program seem to be much the same
as those of the recording program.
A certain amount of setting up is required before the recorder is ready to do anything useful, and the
software includes a 'guided tour' that helps to get you started. The first task is to run the recorder
(Fig.7) and then select a filename for the new data to be saved under. Then the Settings menu plus
some dialogue boxes are used to set such things as the rate at which data will be read, the maximum
number of samples to be taken, threshold levels for the l.e.d. and digital output (where required), and
the channel to be used. Once the preliminaries have been completed the data logging can commence,
and there are tape recorder style control buttons just beneath the main menu. These provide re-record,
record, pause/resume, and stop functions.
The three control buttons on the other side of the screen are used to view data. The first button just
brings up a simple text editor that can be used for notes. The other two buttons bring up the data as
a table of results or a graph (Fig.8). There are various control buttons in the graph window that permit
part of the graph to be expanded and viewed in detail, the graph to be printed or copied to the
clipboard, and so on.
In addition to the standard kit, Pico offer a deluxe version that also includes two temperature sensors
and one pH type. One sensor of each type is shown in Fig.10. The interface is apparently compatible
with any standard pH sensor. The deluxe version costs £99 plus V.A.T.
With PicoScope set to read the appropriate sensor or sensors it is possible to have a straightforward
readout of temperature or pH values, and (or) a graph showing how the data changes over a period of
time (Fig.9). The temperature sensors cover a range of -10°C to 105°C, and pH is measured over a
range of 0 to 14. Probably most professional users and experimenters will opt for the standard kit, but
the deluxe kit seems to be a good choice for educational users.
|
The interface board is well built and getting it 'up and running' is about as simple as it possibly could
be. With built-in sensors the unit can be used for some simple experiments straight away. The price is
good but not especially low for what is really a fairly simple interface, but the inclusion of the
PicoScope and PicoLog soft-ware makes both the standard and deluxe kits very good value for
money.

|
As pointed out previously, DrDAQ is primarily aimed at educational establishments, and it can certainly
be recommended to those involved in teaching computer interfacing, or wishing to use computer based
equipment when demonstrating appropriate scientific experiments. Incidentally, the Pico Technologies
web site has details of numerous experiments that can be carried out using DrDAQ, and this information
will be included on the CD-ROM included with the kits.
DrDAQ is also suitable for professional users requiring an inexpensive but effective analogue-to-digital
converter, but only if they do not require high sampling rates. The DrDAQ kits have enormous play
value for the electronics hobbyist, and are eminently suitable for anyone looking for an inexpensive
and easy way into computer interfacing.
The DrDAQ standard kit costs £79.90 (£59.00 plus £9.00 for delivery within Europe, and VAT). The all
inclusive prices for the kit with two temperature sensors and one pH sensor is £126.90, or £103.40 with
two temperature sensors but no pH type. Both types of sensor are available separately.
|


